Why “skin maps” are becoming the default UX
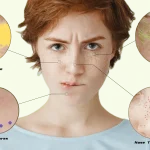
A lot of modern skin-analysis products now present results as a scientific skin map—users can see redness, spots, pores, oil, dehydration, and lines as overlays instead of reading vague text. That visual style is not just “nice UI”; it’s how you build trust and actionability in seconds. Haut.AI, for example, positions its face analysis as turning a photo into a scientific skin map with “clinical precision” messaging.
For builders, the key takeaway is simple: you don’t want to build detection models from scratch. You want an API that returns:
- structured metrics (scores, severity, ratios)
- overlay-ready maps (heatmaps / transparent PNGs)
- optional marks/outlines for regions (polygons, rectangles)
AILabTools’ Skin Analyze Pro is designed for exactly this pattern (skin color/texture, eye bags, dark circles, wrinkles, acne, spots, etc.), and it supports returning both scores and mapping images via parameters like return_maps and return_marks.
Where this fits: 5 high-value scenarios (and what users expect)
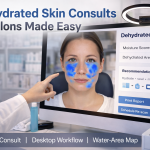
1) Beauty salon / medspa desktop station (in-store “skin consultation”)
Goal: Convert walk-ins into treatments + memberships with a 2–3 minute “scan → explain → plan” flow.
User expectations
- guided photo capture (lighting/pose)
- instant visualization (redness map, spots map, dehydration map)
- a printable/shareable report
- product + treatment plan that feels “personal”, not generic
2) E-commerce personalization (skincare quiz replacement)
Goal: Reduce hesitation and increase add-to-cart by matching routines to actual skin signals.
User expectations
- “one selfie, get my routine”
- show me why (overlay proof)
- re-scan after 2–4 weeks to show progress
3) Tele-derm / online consult intake (triage, not diagnosis)
Goal: Convert messy user photos into structured intake: severity scores + regions to review.
User expectations
- clear disclaimer: “supporting information, not a medical diagnosis”
- consistent before/after comparisons
- doctor/esthetician view vs user-friendly view
4) Self-service kiosk (retail counter / pharmacy)
Goal: High-throughput scanning that drives product discovery.
User expectations
- 60–90 seconds total
- big, obvious heatmaps
- QR code report / product shelf mapping
5) Mobile “skin tracking” app (retention engine)
Goal: Weekly check-ins + trend charts.
User expectations
- consistent capture guidance (same lighting/distance)
- score trends + overlay diffs
- nudges: “re-scan in 7 days”
What to build (without over-engineering)
The minimum product modules
- Capture & quality gate
- framing + face size check
- lighting check (too dark / backlit)
- angle check
- Analysis call (API)
- send selfie image
- request only the maps you need (performance + cost)
- Results composer
- show scores (0–100)
- overlay maps (toggle)
- highlight “top 3 concerns”
- Recommendation layer
- rules-based starter (fast to ship)
- later: catalog matching / LLM explanation
- Report & tracking
- PDF/HTML report
- save scores + key ratios for trends
- optional “before/after comparison view”
The “trust UX” pattern: overlay maps + short explanations
When users see overlays, they understand your product in ~3 seconds.
AILabTools Pro supports a set of mapping images that are explicitly designed to be overlaid on the original image (some are transparent PNG, some are on a white background), e.g.:
red_area(redness/sensitivity map)brown_area(pigmentation map)texture_enhanced_pores(pore area, transparent)texture_enhanced_blackheads(blackheads, transparent)texture_enhanced_oily_area(oil shine, transparent)texture_enhanced_lines(wrinkles/lines, transparent)water_area(dehydration; darker blue = more dehydrated)rough_arearoi_outline_map(blemishes/acne)texture_enhanced_bw(cropped B/W “proof mode”)
UX suggestion
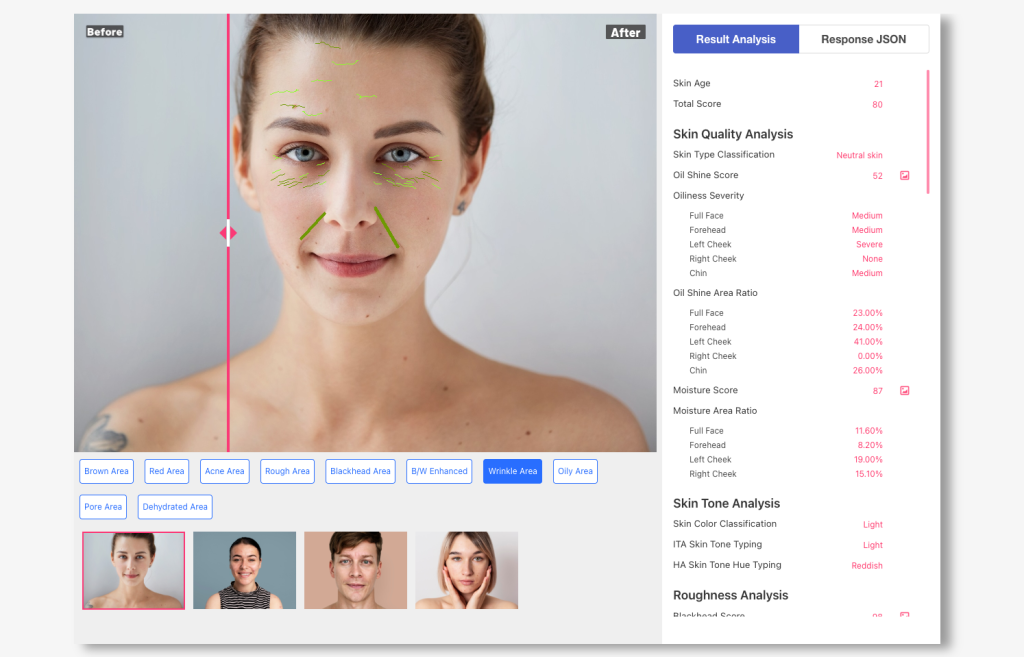
- Tabs like your screenshot (“Red Area / Brown Area / …”) work great.
- Each tab shows:
- 1 overlay
- 1–2 key numbers
- 1 short action sentence (“Focus on calming routine for cheek redness.”)
Image placement ideas (3–5 images)
- Image 1: “Scan → Maps → Report” 3-step flow diagram
- Image 2: Face + “Red Area” overlay toggle
- Image 3: Face + “Brown Area” overlay toggle
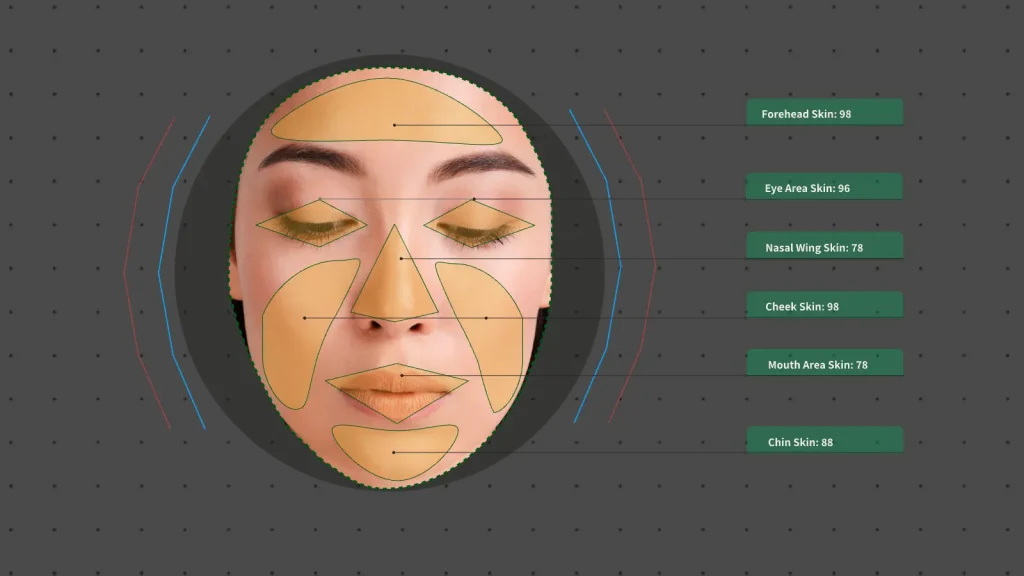
- Image 4: “Dehydrated Area” (water_area) overlay showing darker blue patches
- Image 5: Before/After report (scores + overlays)
Technical blueprint: reference architecture (works for all 5 scenarios)
Recommended architecture
- Client (Web/App/Kiosk): capture image + show overlays
- Your backend (recommended):
- stores API keys securely
- performs request signing / rate limiting
- handles retries and timeouts
- optionally stores only derived metrics (not the image)
- AILabTools Skin Analyze Pro API: returns scores + maps + marks
Image requirements you should enforce
To keep accuracy stable, implement the same constraints the API suggests:
- JPG/JPEG, ≤ 8MB
- resolution between 200×200 and 4096×4096
- minimum face size: face box side length ideally > 400px
- avoid heavy occlusion/blur; keep yaw ≤ ±30°, pitch ≤ ±40° (recommended)
These become your “quality gate” rules in UI.
What you get back: scores + maps + optional outlines
A) Scores (easy for dashboards)
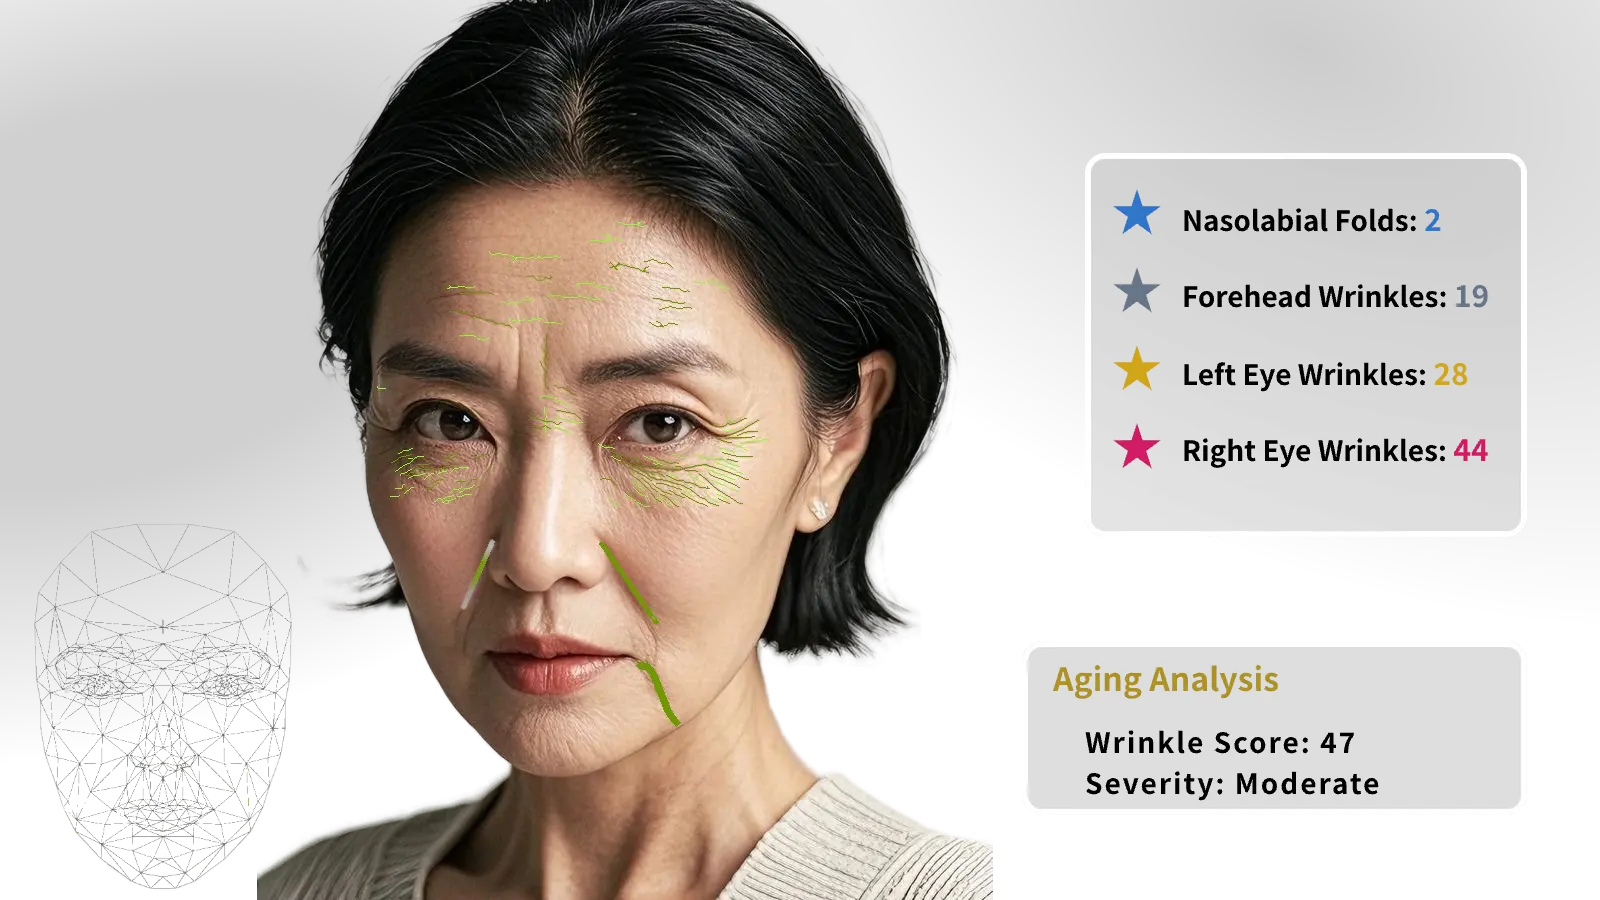
Skin Analyze Pro returns a score_info object with 0–100 scores for:
- wrinkles, oily intensity, pores, blackheads, acne, sensitivity, dark circles, etc.
Use these for:
- “Top concerns” ranking
- trend charts (week over week)
- thresholds that trigger advice content
B) Maps (easy for trust & explanation)
Returned under face_maps, keyed by the requested return_maps items.
C) Marks/outlines (for precise UI)
If you need polygon outlines (e.g., sensitive zones) or detailed wrinkle lists, request return_marks such as sensitivity_mark, wrinkle_mark, melanin_mark, etc.
Example: Redness/sensitivity metrics
In v1.5.1 docs, the sensitivity object includes:
sensitivity_area(percentage of sensitive red area on the face)sensitivity_intensity(0–100 intensity)
…and notes it should be used withred_areamap.
API example (product-neutral): request only what you need
cURL
curl --request POST
  --url https://www.ailabapi.com/api/portrait/analysis/skin-analysis-pro
  --header 'Content-Type: multipart/form-data'
  --header 'ailabapi-api-key: YOUR_API_KEY'
  --form 'image=@"/path/to/selfie.jpg"'
  --form 'return_maps=red_area,brown_area,water_area,texture_enhanced_pores'
  --form 'return_marks=sensitivity_mark,melanin_mark'
JavaScript (Node / Next.js Route Handler style)
import FormData from "form-data";
import fetch from "node-fetch";
import fs from "fs";

export async function analyzeSkin(filePath) {
  const form = new FormData();
  form.append("image", fs.createReadStream(filePath));
  form.append("return_maps", "red_area,brown_area,water_area,texture_enhanced_pores");
  form.append("return_marks", "sensitivity_mark,melanin_mark");

  const res = await fetch("https://www.ailabapi.com/api/portrait/analysis/skin-analysis-pro", {
    method: "POST",
    headers: {
      "ailabapi-api-key": process.env.AILABTOOLS_API_KEY,
      ...form.getHeaders(),
    },
    body: form,
  });

  const json = await res.json();

  // Typical usage:
  // json.result.score_info.wrinkle_score / acne_score / sensitivity_score ...
  // json.result.face_maps.red_area (base64 image)
  return json;
}
How you render overlays
- For transparent PNG maps (pores/blackheads/oily/lines/rough/acne outlines), simply layer them on top of the original.
- For white-background maps (like
water_area,red_area,brown_areadescribed in docs), use blending or a simple “white-to-transparent” preprocessing before overlaying (or show side-by-side).
Data policy and “non-medical” positioning (important)
If you serve clinics/medspas or tele-derm intake:
- present outputs as skin condition signals / cosmetic insights
- avoid diagnostic language (“disease detection”, “medical diagnosis”) in consumer UI
- add a clear disclaimer in the report: “for informational/cosmetic guidance only”
Rollout plan that actually ships
Week 1–2: MVP you can demo
- capture + quality gate
- call API with 3 maps (red/brown/water) + score_info
- show overlay toggles + top concerns
- generate a simple HTML report
Week 3–4: Business impact version
- add pores/oily/acne map tabs
- add “recommended routine steps” (rules-based)
- add history + trend charts
Week 5+: Scale and optimize
- A/B test:
- overlay-first vs score-first UI
- “top 3 concerns” wording
- add catalog matching (e-commerce) or service menu mapping (salon)
Notes on versioning
AILabTools documentation indicates that some older API versions may be deprecated or no longer maintained, so treat API versioning as a first-class integration concern and periodically verify you’re on the recommended version.
Next step (docs)
To implement exactly what’s described above (scores + return_maps overlays + optional marks), refer to the Skin Analyze Pro API documentation and the return_maps / return_marks sections.